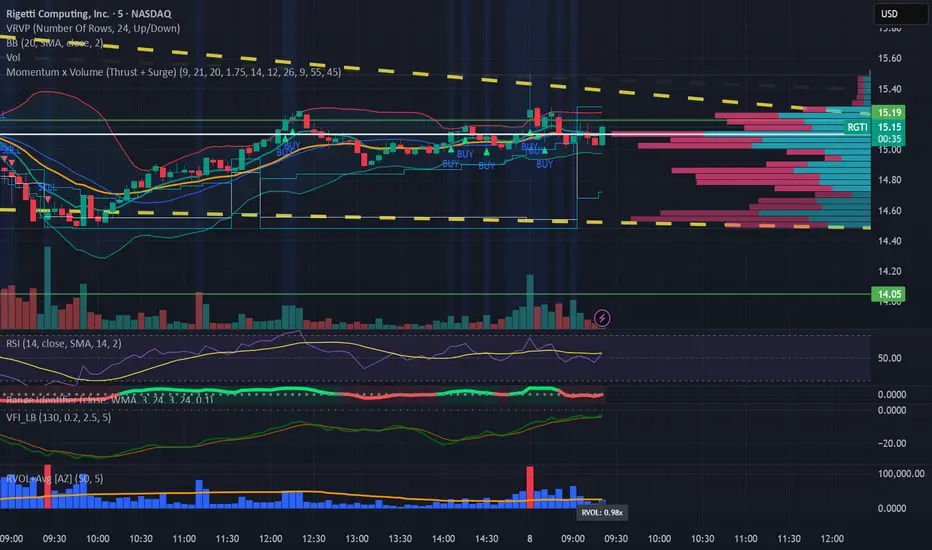
Relative Volume (RVOL) + Average Volume [AZ]The script helps you instantly see whether today’s volume is unusual compared to the past (relative volume). It’s built for breakout/fakeout filters, like the 15-minute ORB strategy you’re running.
Wyszukaj w skryptach "THE SCRIPT"
Projected 65min VolumeThe script provides relative volume for the first 5min candle after its close vs 14 avg and estimates projected volume for the first 65min candle in the trading session vs avg value.
!!!The indicator is designed to work only at 5min TF!!!

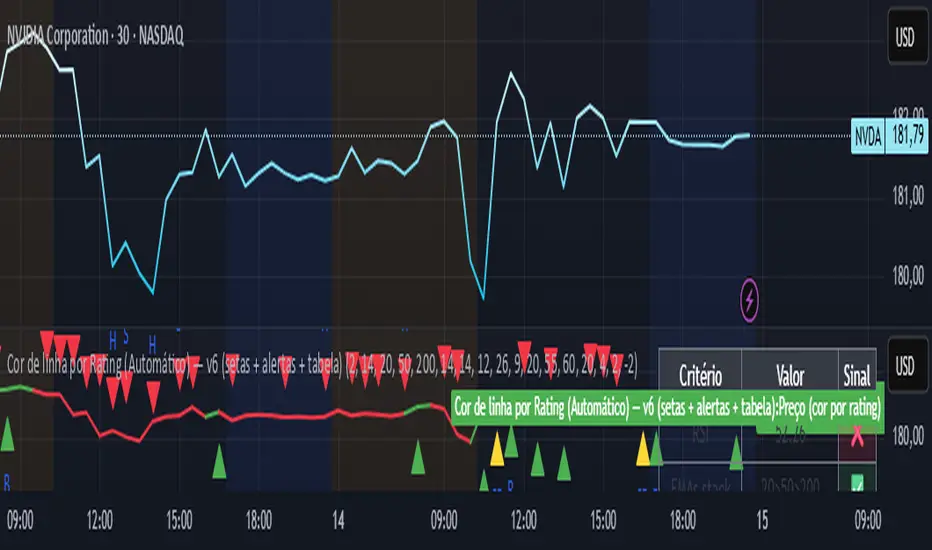
Line color best indices grouped by Artificial Intelligence
The script uses the best buy indicators, such as moving average crossovers, RSI, and others selected by AI. The idea is to determine whether the stock is classified as a strong buy (yellow line), a buy (green line), or a red (sell)
ATR Stop Loss Non-Decreasing & LineThe script calculates a custom stop-loss level based on the Average True Range (ATR) indicator, ensuring that this stop-loss level never decreases from one bar to the next unless a reset condition is met. It also visually displays the ATR value and the calculated stop-loss level as a line on the chart.

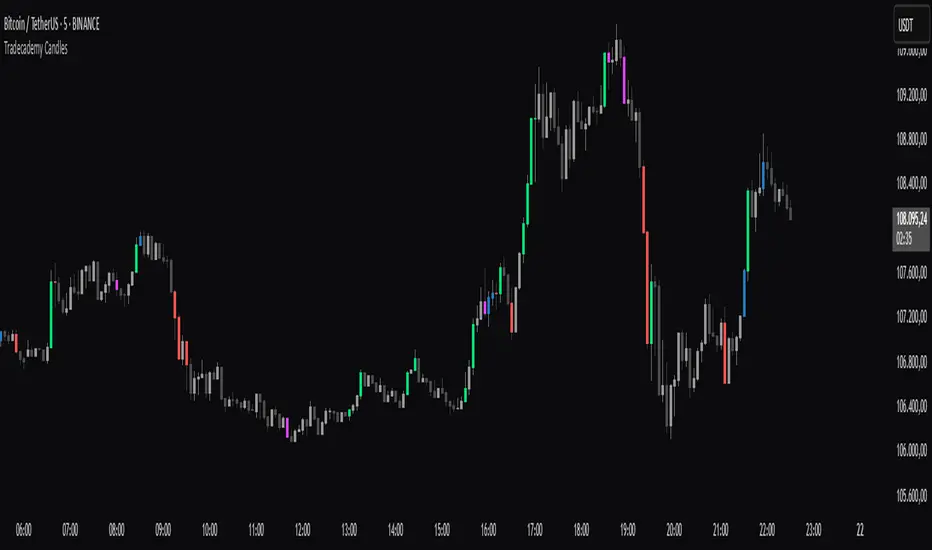
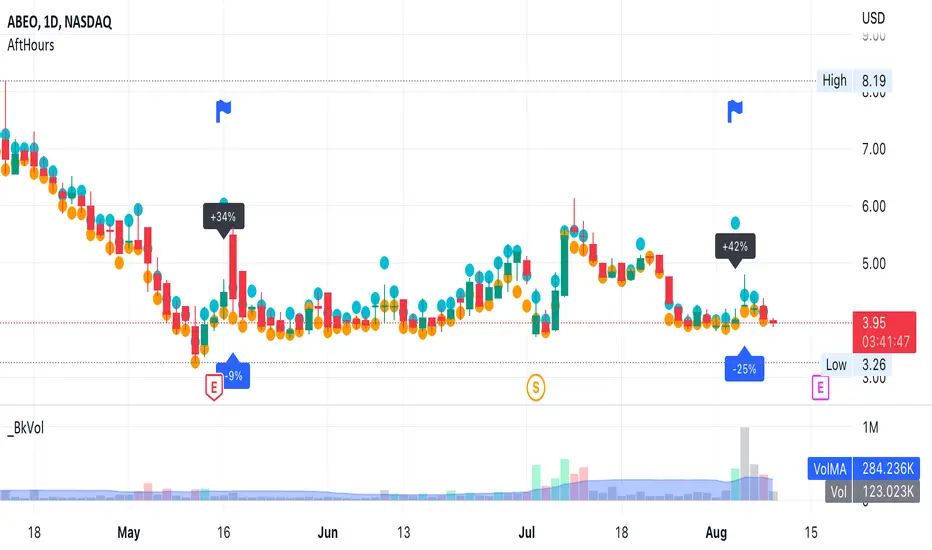
Tradecademy CandlesThe script highlights high-volume candles .
Upward candles with significantly increased volume = green
Upward candles with moderately increased volume = blue
Downward candles with significantly increased volume = red
Downward candles with moderately increased volume = pink
Show-BiasThe script looks at the current bar and prints the bullishness or bearishness bias based on the high, low and close values.
Bullish bias:
----------------
Higher High
Higher Low
Higher Close
Green candle
Bearish bias:
----------------
Lower High
Lower Low
Lower Close
Red candle

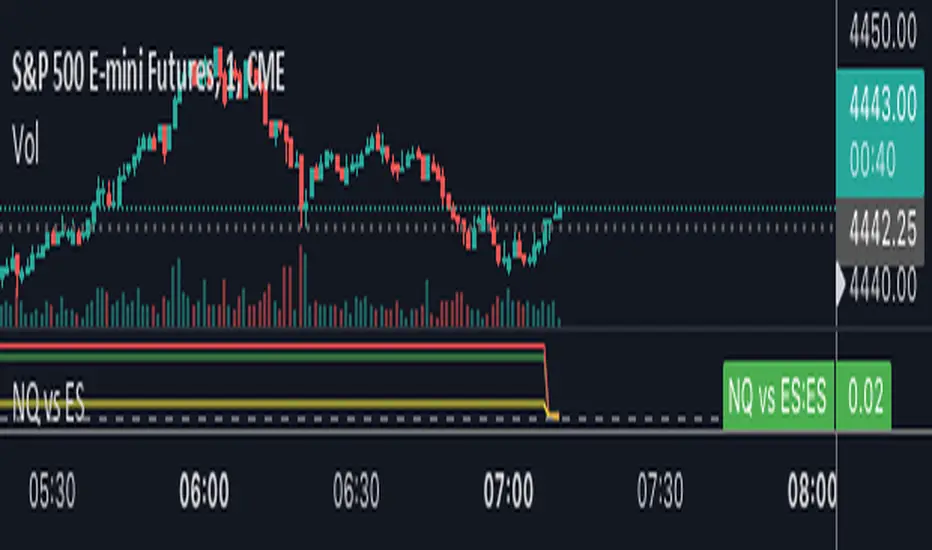
NQ vs ESThe script shows the spread between the realtime NQ and ES percentage change from the day before, from which it is possible to see if NQ is outperforming or underperforming the ES.
[TT] Sectors Dist % From MA- The script shows the distance in percentages from the 200 MA (or any other MA period) , for the 11 SP500 sectors.
- It works based on the current time frames.
Could be useful when working with mean reversion strategies to detect extremes zones and overbought/oversold conditions in the given sectors compared others.

US Fed Rate Hike Historical DatesThe script applies Blue (color can be changed) highlights to the days that the US Federal Reserve Hiked interest rates. Data goes back to the 60's. This can be applied to any chart/timeframe to view how the asset behaved before/during/after Federal Rate Hikes.
****This was updated as of Dec 2022... Any decisions after Dec 2022 will not show up in this indicator.
Versions may be updated periodically to include new data.
Hope this helps. Happy Trades
-SnarkyPuppy

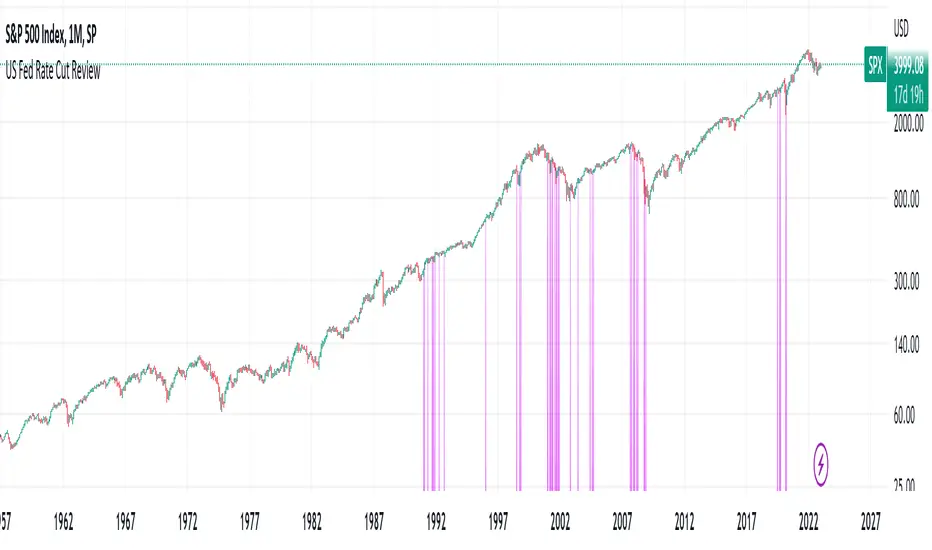
US Fed Rate Cut Historical DatesThe script applies Purple (color can be changed) highlights to the days that the US Federal Reserve Cut interest rates. Data goes back to the 60's. This can be applied to any chart/timeframe to view how the asset behaved before/during/after Federal Rate cuts.
****This was updated as of Dec 2022... Any decisions after Dec 2022 will not show up in this indicator.
Versions may be updated periodically to include new data.
Hope this helps. Happy Trades
-SnarkyPuppy
AfterHours Spike DetectorThe script pulls Lower Timeframe (30min) data to draw High/Low of Out-of-hours/AfterHours session (post-market session & next day pre-market session) on the Daily regular session chart. It then identifies significant AfterHours price changes and what happens to these price Spikes by the Open of the next day regular session.
You can change:
wether to show AfterHours High/Lows
wether to show AfterHours price Spikes
the AfterHours price Spike threshold (default = +/- 10%)
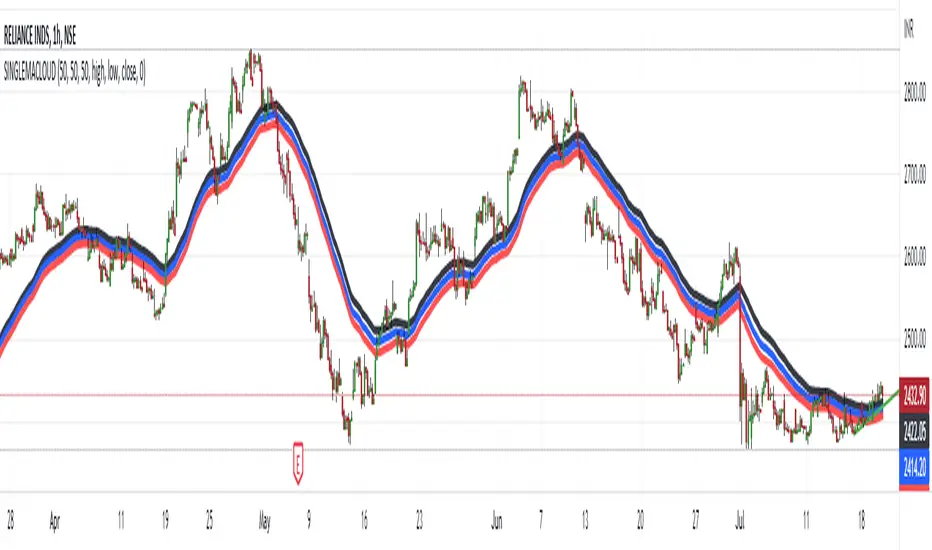
HIGH LOW CLOSE Moving Average ExponentialThe Script is prepared for testing purpose the Added single indicator for getting high low and close.
RSI - S&P Sector ETFsThe script displays RSI of each S&P SPDR Sector ETF
XLB - Materials
XLC - Communications
XLE - Energy
XLF - Financials
XLI - Industrials
XLK - Technology
XLP - Consumer Staples
XLRE - Real Estate
XLU - Utilities
XLV - Healthcare
XLY - Consumer Discretionary
It is meant to identify changes in sector rotation, compare oversold/overbought signals of each sector, and/or any price momentum trading strategy applicable to a trader.

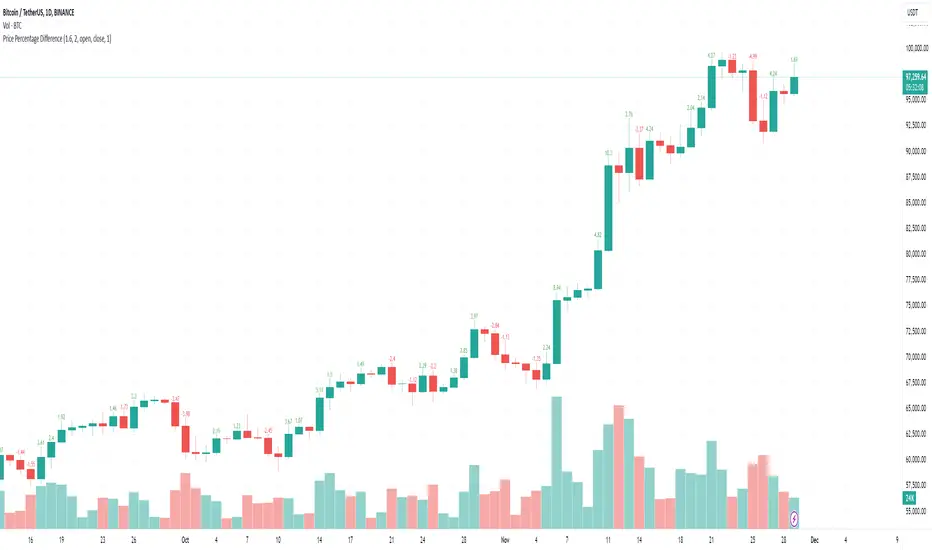
Price Percentage DifferenceThe script prints the percentage difference between open and close. The number of decimals can be between 0 and 5 and is adjustable in the settings.
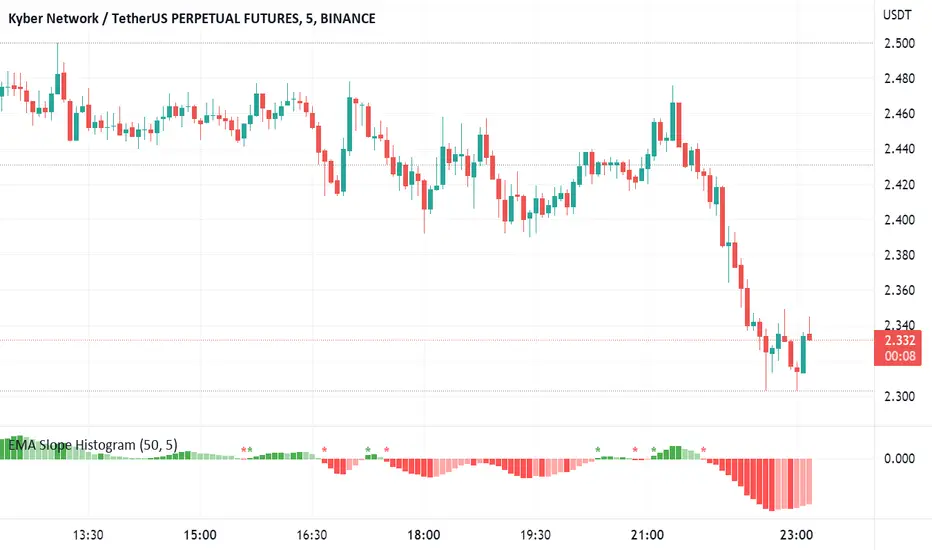
EMA Slope HistogramThe script shows change in a single EMA over a specified period as a histogram. The period of EMA as well as Change period can be specified. Moreover, it also shows change in direction of EMA. The change can be negative for a downward trend and positive for an upward trend.
[_ParkF]Linreg & Trendlines* The script has been uploaded again.
Linear regression and trendline not only facilitate trend identification,
but also identify support and resistance within it,
and linear regression and trendline departure can detect trend changes, which are useful in trading.
Linear regression and trend lines are shown in the chart.
It offers a variety of options, length, color, thickness, on/off switch, etc.
I hope it will help you with your trading.
hope you become rich!
---------------------------------------------------------------------------------------------------------------------------
* 스크립트가 다시 업로드 되었습니다.
선형 회귀(채널) 및 추세선은 추세 식별을 용이하게 할 뿐만 아니라,
또한 그 안에서 지지와 저항을 식별하고,
선형 회귀(채널) 및 추세선 이탈은 거래에 유용한 추세 변화를 감지할 수 있습니다.
선형 회귀(채널) 및 추세선이 차트에 표시됩니다.
길이, 색상, 두께, 온/오프 스위치 등 다양한 옵션을 제공합니다.
거래에 도움이 되셨으면 합니다.
부자되세요!
---------------------------------------------------------------------------------------------------------------------------
* I would like to express my gratitude to zdmre for revealing the linear regression source.

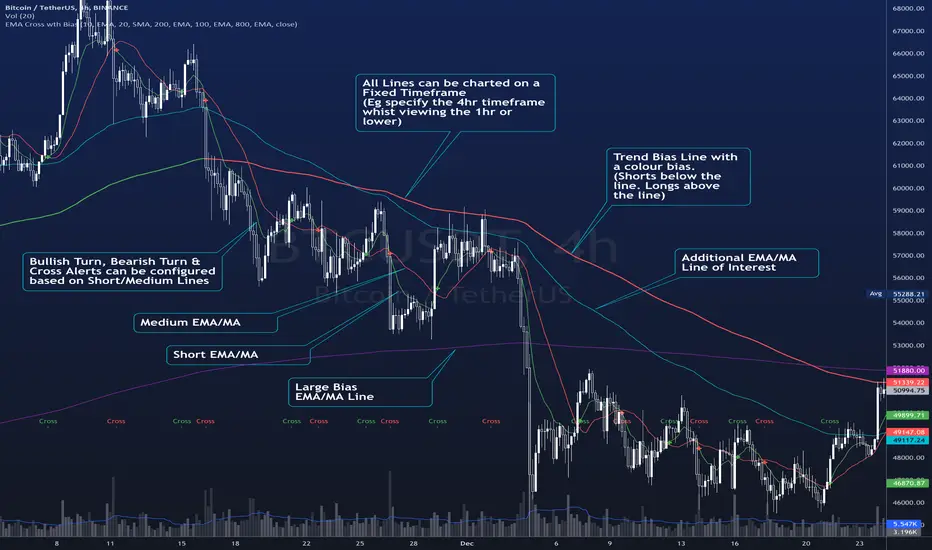
EMA Cross wth BiasThe Script plots 4 Moving averages.
1. Short Moving Average
2. Medium Moving Average
2. Trend Bias (Usually a much slower Moving Average) - Plots in Green when price action is above the line and Red for when price action is below the line.
3. Alerts are triggered when the short MA/ EMA turns. Can be used for Early Entry signals and Exits.
4. Alerts are triggered for Crosses of the Short and Medium MA
Each Moving average line can be confirmed to be a Simple MA or and EMA
Ichimoku Cloud OscillatorThe script looks at how far the price is below or above the ichimoku cloud, and publishes an oscillator.
Low or high oscillator values are indicative of reversals, to assist with long or short entry decisions.

StableF-AdxThe script is ADX-DMI modified verison
-Adx is labeled as Weak trend Below 25 and strong Trend above 25
-Hline is drawn at 25 for better clarification of crossover above 25
-Wait for crossover in +dmi and -dmi and to cross above 25 for any trend clarifcation
-crossover i.e upside cross of +dmi over -dmi is shown buy UP shape
-crossunder i.e downside cross of +dmi over -dmi is Shown buy DN shape
--disclaimer --This is just modified version of Bulit in ADX_DMI indicatior \ NOT advised for buy / Sell purpose

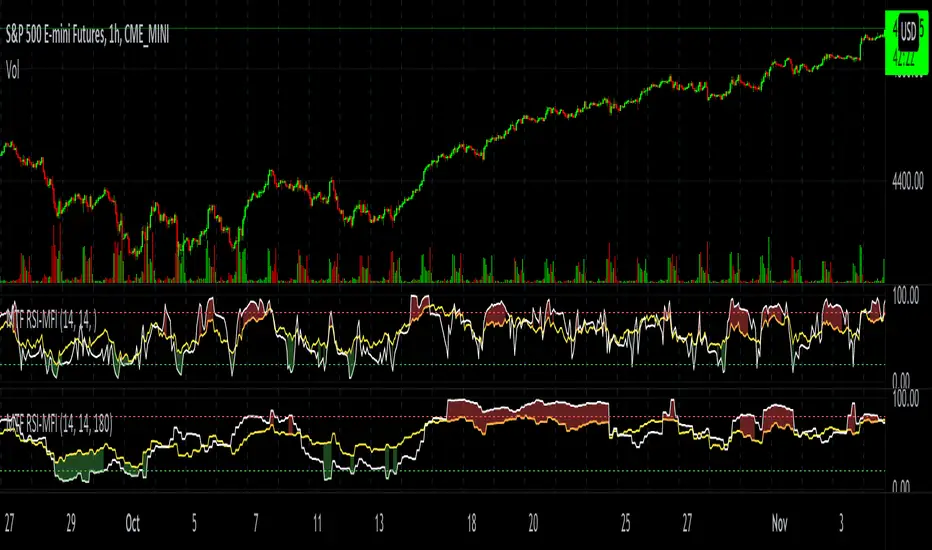
MTF RSI-MFIThe script plots both RSI and MFI of security, automatically highlights oversold and overbought conditions and allows for calculating indicators on timeframes other than the chart.
MTF Bullish/Bearish IndicatorThe script plots a bullish/bearish indicator by evaluating a variety of moving averages for a security across multiple timeframes. It's derived from built in Technical Analysis indicator published by TradingView. The result of evaluation is plotted on the chart in green light/red light format in a configurable location.
evaluated moving averages include
- SMA 10, 20, 30, 50, 100, 200
- EMA 10, 20, 30, 50, 100, 200
- Hull MA 9
- VWMA 20
- Ichimoku Cloud
moving averages are evaluated at chart timeframes and 5 min, 15 min, 30 min, 120 min, 240 min, and daily by default but can be customized.

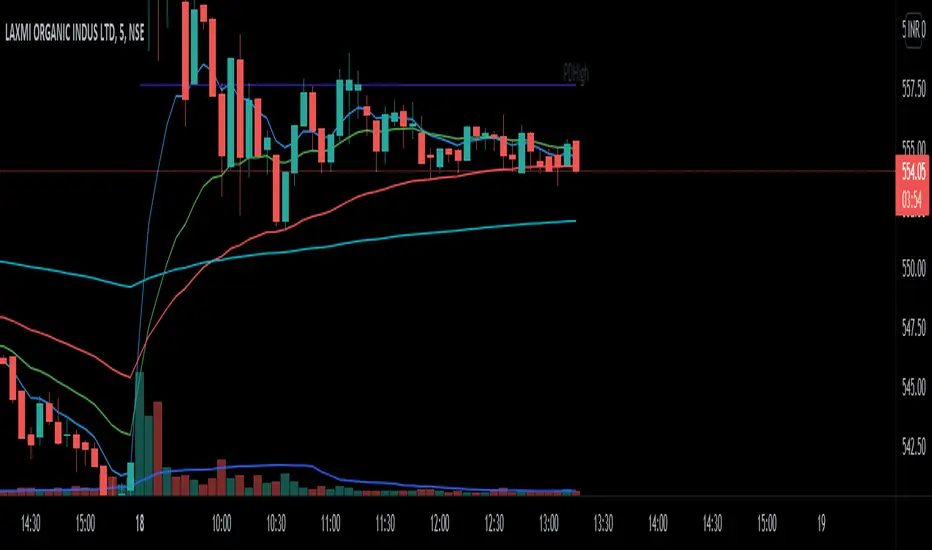
RVC_DecisionPoints By RishabhThe script is a combination of moving averages and previous day low and previous day high.
It can be used for intraday trading and as well as swing trades.
For using intraday I prefer 8 ema and 20 ema to take trades and trail stop losses with 50ema and 200 ema for confirmation.
For swing trades you can always use 50 ema as support to buy on the dip.
The entry is made on the basis of the stock breaks the previous day high or previous day low.
Percent ATRThe script changes the default output of ATR and shows the result based on the percentage. It could be usefull when do you want to know about the percentage of the movement.
